Understanding Mode in Statistics: The Most Practical Math Concept Students Overlook
Among mean, median, and mode, the mode is often considered the easiest — yet students misunderstand its importance. Understanding the mode in statistics is an essential concept for high school students.
Mode helps identify patterns and trends, Frequency statistics making it one of the most practical statistical tools taught in Canadian high schools.
Parents searching for an online math tutor Canada or math tutor Burnaby often notice students struggling with interpreting datasets rather than calculations.
📊 What Is Mode?
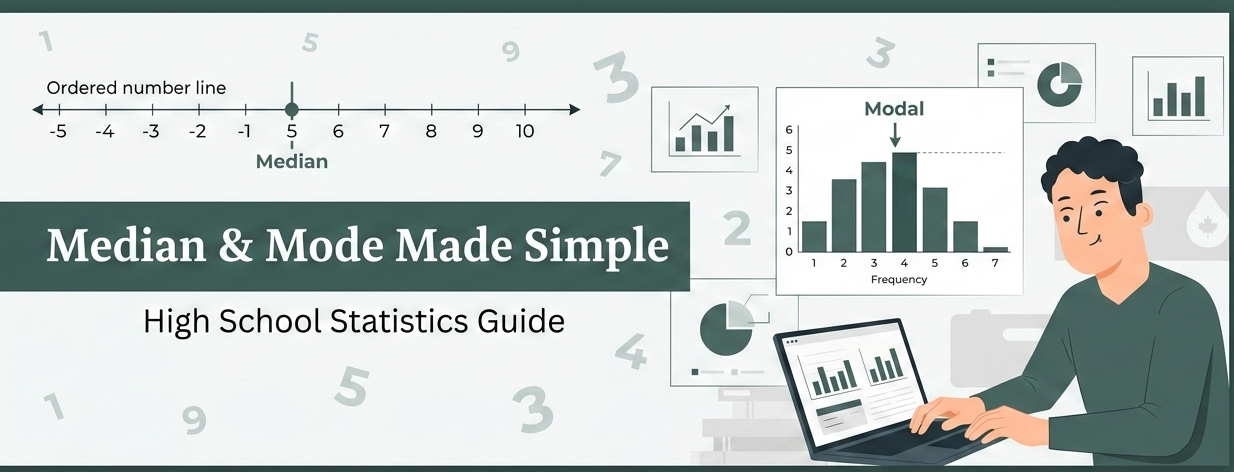
Mode = the value occurring most frequently.
Example:
3, 5, 5, 6, 7, 7, 7, 9
Mode = 7
Datasets can be:
- No mode
- One mode
- Multiple modes
🔍 Why Mode Is Important
Mode answers real questions like:
✔ Most popular product
✔ Most common test score
✔ Frequently occurring measurement
Industries including marketing and healthcare rely heavily on modal data analysis.
Educational datasets analyzed by organizations like OECD often use modal trends to evaluate learning outcomes.
🚨 Student Challenges With Mode
Students struggle when:
- Multiple modes appear
- Graphs represent frequency visually
- Histograms are involved
- Real-life interpretation is required
Conceptual clarity is essential.
📈 Mode & Graph Interpretation
Mode connects directly with:
- Histograms
- Frequency tables
- Bar graphs
The tallest bar represents modal value.
🎓 How Expert Tutoring Helps
At Dr. Shreyank Educare:
– Visual learning methods
– Interactive statistics problems
– Canadian curriculum alignment
– Online + In-person tutoring
📞 +1 672-514-7587
🌐 https://drshreyankeducare.com/
Conclusion
Mode helps students move beyond calculations into data interpretation, preparing them for analytics-driven careers.
Statistics success begins with conceptual understanding.